These are exemplary results of a storm simulation of an unsymmetric gable roof with a fairly exposed row of solar panels. The wind speed was set to 100km/h. This computational fluid dynamics simulation was created using the “custom gable roof” – wizard. Please review the set of results of this simulation below. You receive an equivalent set of results for any simulation on solarcfd.com.
Air Speed Closeup
A slow motion movie of the air flow around roof and panel developing over time. In the first few seconds, the air flow representing the storm is initiated, leading to a turbulent movement. Then, the flow stabilizes to its final state. Colors depict the velocity distribution in m/s. Isn’t that pretty cool? (download video)
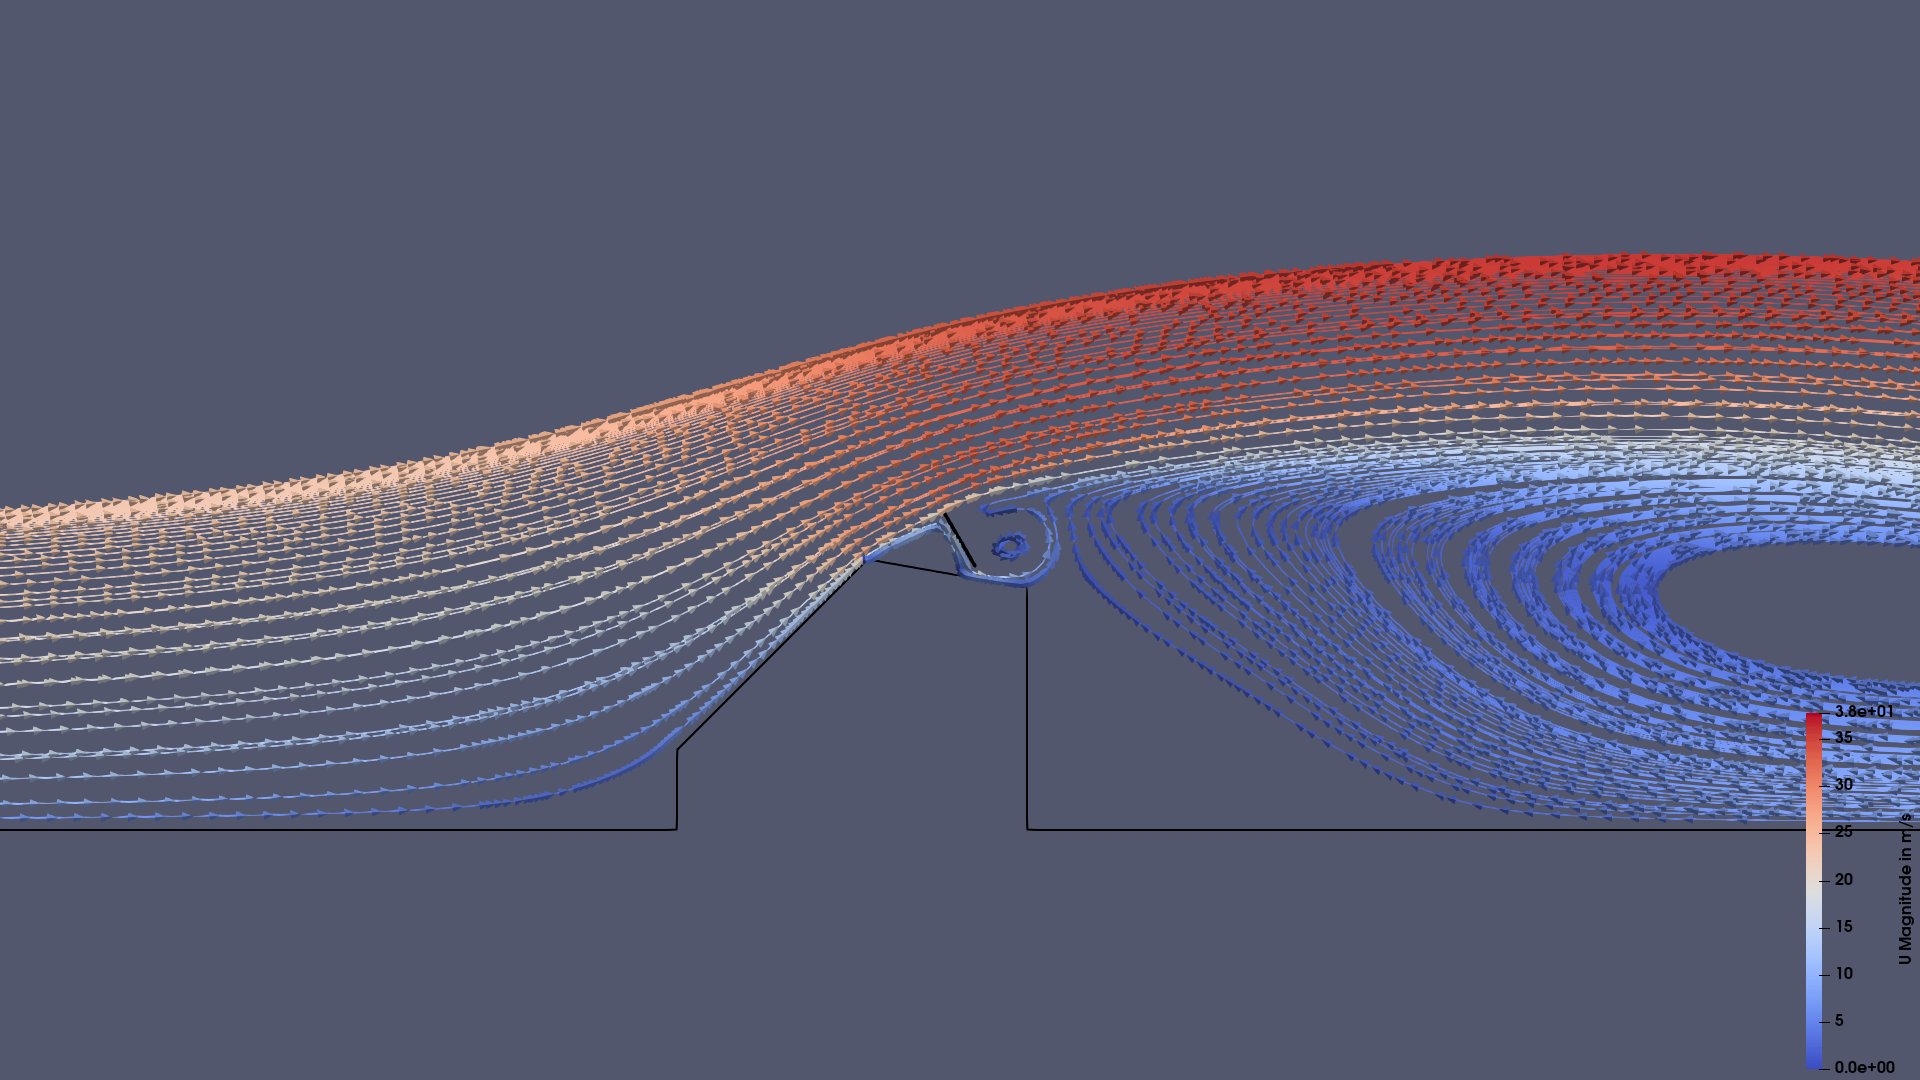
Streamlines
The image shows streamlines of air crossing the scene. Streamlines are travel paths of air molecules, which are also called “trajectories”. The colors indicate the air speed and the small arrows indicate the local flow direction. Note the vortex behind the solar panel containing zones in which the air is flowing backwards in the scene. The same happens in the large vortex behind the building.
Air Pressure Closeup
A slow motion movie of the pressure around the panel and roof over time. Colors depict the relative pressure distribution in Pa (N/m^2). Pressure differences between panel front and back directly result into forces acting on the panel. These forces are listed in the report. (download video)